True fertilizer picture depends on soil sampling depth

A history lesson: In the 1960s and ‘70s when a database was developed for fertilizer recommendations from a soil test for the western Canadian prairies, all the sampling was done to 24 inches (60 centimetres).
The samples were divided into zero-to-six-inch (0 to 15 cm) and six-to-12-inch (15 to 30 cm) and 12-to-24-inch (30 to 60 cm) samples for analysis. The shallow sample was used to collect information on the “non-mobile” nutrients like phosphorus and potassium along with “mobile nutrients” like nitrate (NO3) and sulphate (SO4).
The lower depth samples were used to extract only the mobile nutrients. This was the database that acts as a foundation upon which current fertilizer recommendations were built. Subsequent work was done using these standard depths that, by the way, are now standard throughout the temperate agricultural areas.
The concept behind these depths is that the more leachable nutrients like NO3 and SO4 are moved by soil moisture downward in the soil profile to depths below six inches and often to depths of 24 inches or more.
In the 1980s it was observed by management at the Saskatchewan Soil Testing Lab, and subsequently EnviroTest Labs, that a limiting factor to getting more fields tested was the zero to six inches and six to 24 requirement.
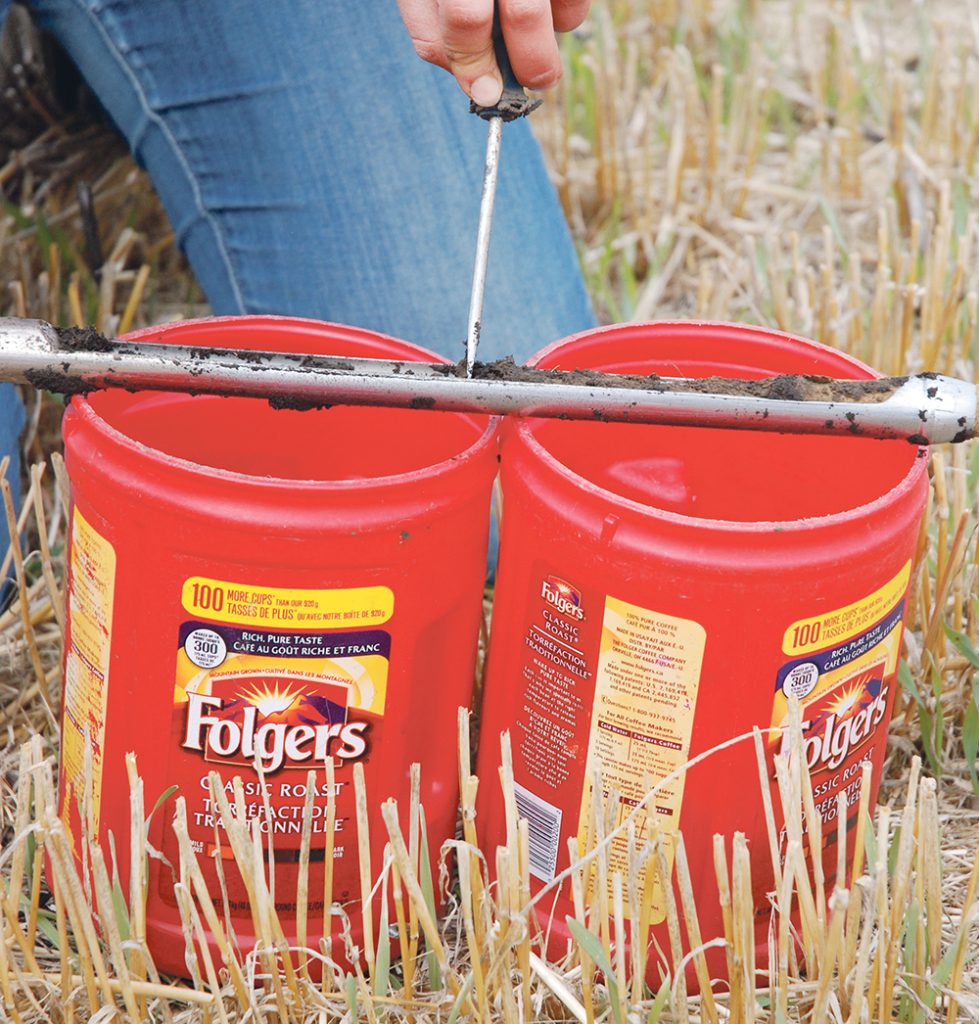
In those years, much of the sampling was done by Joe Farmer by borrowing a probe from the ag rep’s office or his local fertilizer dealer and sampling the fields himself. Getting a good sample was not that easy.
As well, Mr. Farmer was cheating on the number of samples he took, often only five or six compared to the recommended 16 to 20 per field.
The testing lab looked for ways to make things easier while maintaining a reliable recommendation. SSTL and the Soil Science Department began work on the concept of taking a zero-to-12-inch (30 cm) sample and comparing these to 0 to six and six-to-24-inch samples.
While they found they could use the shallower sampling to develop a model that would transfer the fertilizer recommendations from the old data base into zero-to-12-inch recommendations, they also realized it was a compromise and that, in some situations, not all the NO3 below the 12-inch level would be accounted for.
To put it bluntly, efficiency trumped accuracy.
The recommended sampling depth for samples for SSTL changed to 12 inches in about 1991 for NO3-only tests and many western Canadian labs changed their recommended sampling depth in later years.
Fast forward to 2021. What has changed? Today most soil sampling is done by commercial samplers using trucks equipped with hydraulic probes and trained samplers that will hopefully result in more consistent cores. They also have access to GPS that allows for sampling in close to the same location year after year.
With the advent of variable rate technologies, fields are divided into management zones for zone-specific sampling and recommendations. We have also seen new technologies that use the nutrient supply rates of the soil rather than measuring what is in the soil.
While these can be seen as positives, many commercial sampling companies continue sampling at either zero-six and six-to-12-inch samples, 0-to-12-inch samples or zero-to-eight-inch samples. Once again, efficiency trumped accuracy.
There are now fewer analysis labs in Western Canada, resulting in many samples shipped to Eastern Canada or to the U.S. Midwest, where recommendations are not made for western Canadian conditions.
Let’s look at the impact of sampling depths.
In 80 to 90 percent of the years, assumptions made about residual NO3-N below the sampling depth is probably accurate enough to make good recommendations. In the best of conditions, soil sampling is not a very accurate science and, in most fields, in most years, NO3-N carryover is quite low.
Western Canadian farmers have done a good job of fertilizing to a target yield so we see the carryover as acceptable. In these normal situations, the fact that you over or underestimate 10 pounds of nitrate below the sampling depth is not critical.
However, in 10 to 20 percent of the years where conditions are abnormal, the levels of NO3-N can be considerable. 2021 is, in many areas, one of those abnormal” years. I have seen many six-to-24-inch samples from eastern Saskatchewan and northwest Manitoba with 80-plus and some over 120 pounds of NO3-N.
Let’s take a few minutes to understand why this situation occurred in 2021.
First, many farmers fertilized for growing close to a maximum yield crop as they saw some of the best prices they had ever encountered in their farming careers.
Rainfall, as we all are aware, was limited during the growing season so yields in many areas were only 25 to 50 percent of normal. This, along with much higher-than-average heat, resulted in yields that were often only half or less to what was fertilized for.
For example, if a grower fertilized for a 60-bushel canola crop, charts would indicate the need for about 200 lb. of N. If 150 lb. of N were applied and there was only a 25-bushel crop, our chart says we removed 50 lb. of N. That leaves us with 100 lb. in the system.
There were no leaching losses this year and probably very little denitrification losses so we can anticipate there would be 100-plus lb. of NO3-N in the system.
One weather station report shows just over 2.4 inches (60 mm) of rainfall occurred between Aug. 20 and 24. As this fell onto soil that was probably at the permanent wilting point (PWP), the water would have soaked into the soil, carrying much of the NO3-N with it.
Charts show that a foot (30 cm) of fine sandy-loam soil will hold 1.5 to two inches (37.5 to 50 mm) of water. Our 60 mm of rain would have moved more than 12 inches and possibly 18 inches into the soil, taking with it dissolved NO3-N.
That is why, in areas that saw August and September rainfall, we are seeing higher amounts of NO3-N below the 0 to six-inch levels.
Ask your soil sampling company how deep it samples and, if you received significant rainfall in late August and early September, assume all your residual NO3-N may not have been accounted for if the sampling depth was less than 24 inches.
Especially in a year where nitrogen prices are at near record levels, make sure you look for nitrogen deeper in the soil profile.
Source: producer.com

