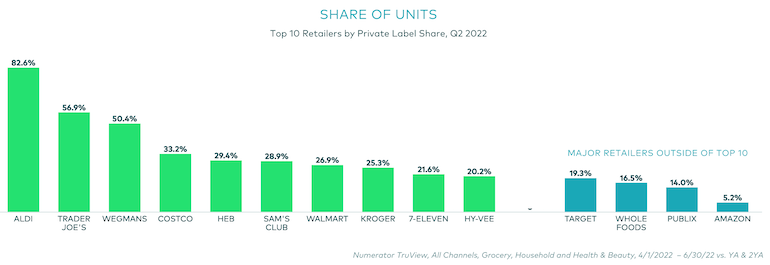
It will come as no surprise that four of the top five private brands are found in retail giant Walmart’s portfolio, but when it comes to leading private-label share in volume and growth, nobody beats small-format discount grocer Aldi.
Those are two of the takeaways from new research on private-label trends from Chicago-based consumer data specialist Numerator. And here’s a third: As inflation continues to squeeze Americans’ grocery budgets, more consumers are willing to trade down from national brands to private labels.
Aldi dominates in private-label share for grocery, household, and health and beauty products, which account for more than three-quarters (77.5%) of its total sales, Numerator’s private-label trend tracker shows. Roughly 90% of the items in Aldi’s stores are own brands.

Another private-brand-focused grocer, Trader Joe’s, comes in a distant second in terms of private-label share of spend at 59.4%, followed by Wegmans Food Markets (49.4%), Costco Wholesale (33.5%), Sam’s Club (30%), H-E-B (26.9%), Walmart (23.3%), Kroger (22.1%), Meijer (15.8%), Hy-Vee (15.2%), Target (15.1%), Whole Foods (14.7%) and Publix (13.6%).
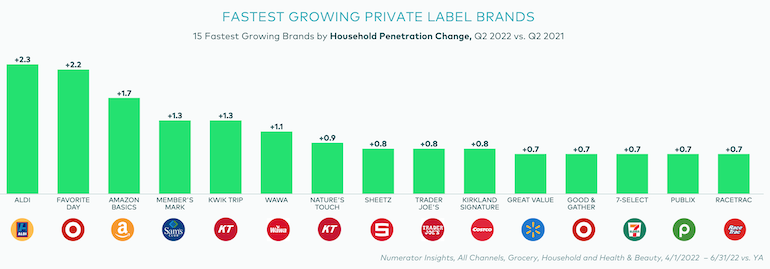
Aldi’s brands are also the fastest-growing, rising 2.3 points in private-label household penetration from Q2 2021 to Q2 2022. The next fastest-growing store brands in that time frame were Target’s Favorite Day (+2.2 points), Amazon Basics (+1.7), Sam’s Club’s Member’s Mark (+1.3), Kwik Trip (+1.3), Wawa (+1.1) and Kwik Trip/Nature’s Touch (+0.9). Sheetz, Trader Joe’s and Kirkland Signature (Costco) all grew 0.8 points in household penetration over that span, while Great Value (Walmart), Good & Gather (Target), 7-Select (7-Eleven), Publix and RaceTrace were up 0.7 points.

Meanwhile, Walmart owns the four top private-label brands over that time period, ranked by household penetration, with its Great Value (purchased by 72.7% of U.S. consumers), Equate (51%), Marketside (44.2%) and Freshness Guaranteed (40%). Dollar Tree ranks fifth at 32.5%, followed by Kroger (30.9%), Aldi (30.5%), Walmart’s store brand (29.8%), Costco’s Kirkland Signature (28.4%) and Sam’s Club’s Member’s Mark (26.5%).
“The days of treating private-label products as untrackable are over,” according to Eric Belcher, CEO of Numerator. “With market share now approaching 50% in some major categories, CPG manufacturers need visibility into the brand-level performance of private labels today more than ever before.”

In today’s inflationary environment, price is becoming more important than brand name for consumers across all income levels, and they’re turning to private labels to save money. Numerator’s study shows that nearly two in five high-income (39.5%) and middle-income (38.8%) consumers are purchasing private brands as a cost-saving measure. More than half of high-income consumers (56.9%) rate their value as excellent or above average, compared with 55.2% of middle-income and 52.5% of low-income shoppers.
Despite the perception of private label as a brand for cash-strapped households, the share of private-label grocery products was similar across income levels, at 17.1% for low-income, 17.9% middle-income and 17.2% for high-income households.

Other key findings on private brands by Numerator included the following:
• Private labels account for 17.4% of sales in the grocery sector, while branded products account for 82.6%.
• Grocery share in the club channel for own brands is 32.1%, followed by mass (22.6%), online (20.2%), food (18.6%), dollar (9.9%) and drug (4.7%).
• Amazon captures only 3% private-label share in the combined grocery, household and HBC sectors.
Within the household products sector, store brands represent nearly $1 in $5 spent (19.5% of sales), compared with 80.5% for branded items. In the club channel, private label accounts for 35.5% of all household product sales, followed by mass (19.4%), dollar (19.2%), food (18.7%), online (13.1%) and drug (8.9%). Online was the only channel to see consistent growth over the past two years (+3.1 points vs. a year ago, +0.6 points vs. two years ago).
And in health and beauty care, private labels account for for more than $1 in $10 of consumer spend, or 11.9%, compared with 88.1% for branded items. The drug channel leads in HBC own-brand sales at 18.4%, followed by dollar (17.7%), mass (16.9%), club (14.2%), food (8.7%) and online (5.2%). HBC private-label share varies across income levels, with a 17.2% sector spend among low-income consumers versus 14.9% for high-income consumers.


